React Native How To Debug
How To Debug

It is important to learn how to debug the code in our application to be able to troubleshoot many situations.
in this page we will learn how to open debugger from our emulator and debug our code
In order to activate debugger in our emulator we need to access the developer tools.
CTRL + M in the emulator will open developer menu where we will encounter the debug option.
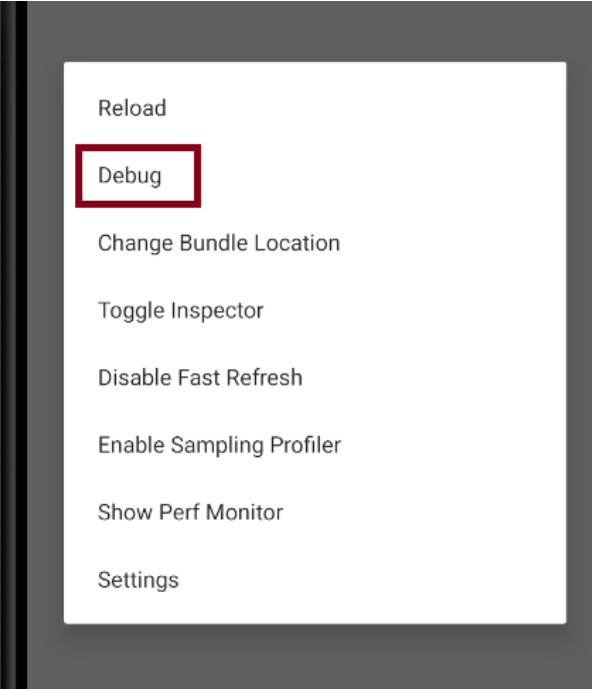
This will re-load our application in debug mode and open react native debugger in chrome
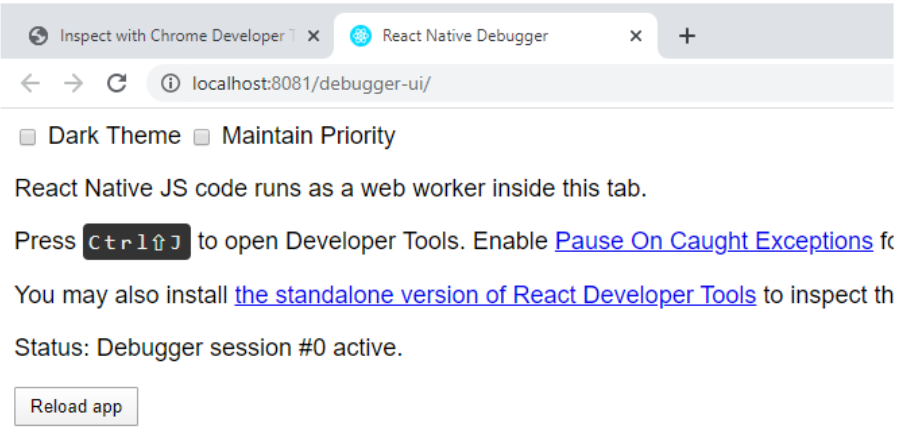
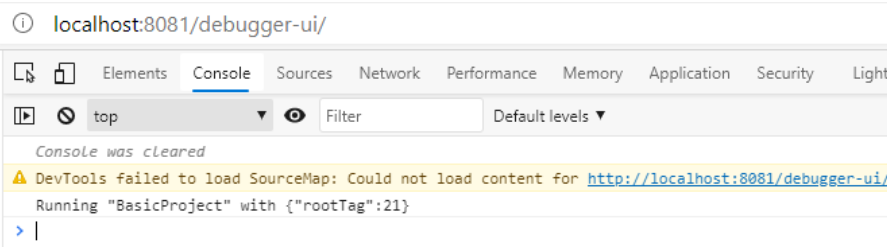
Use Ctrl+Shift+j to open developer tools.
this will provide access to the console logs under the console tab page, where we can see all the events performed in the application and output of any console.log command in our code.
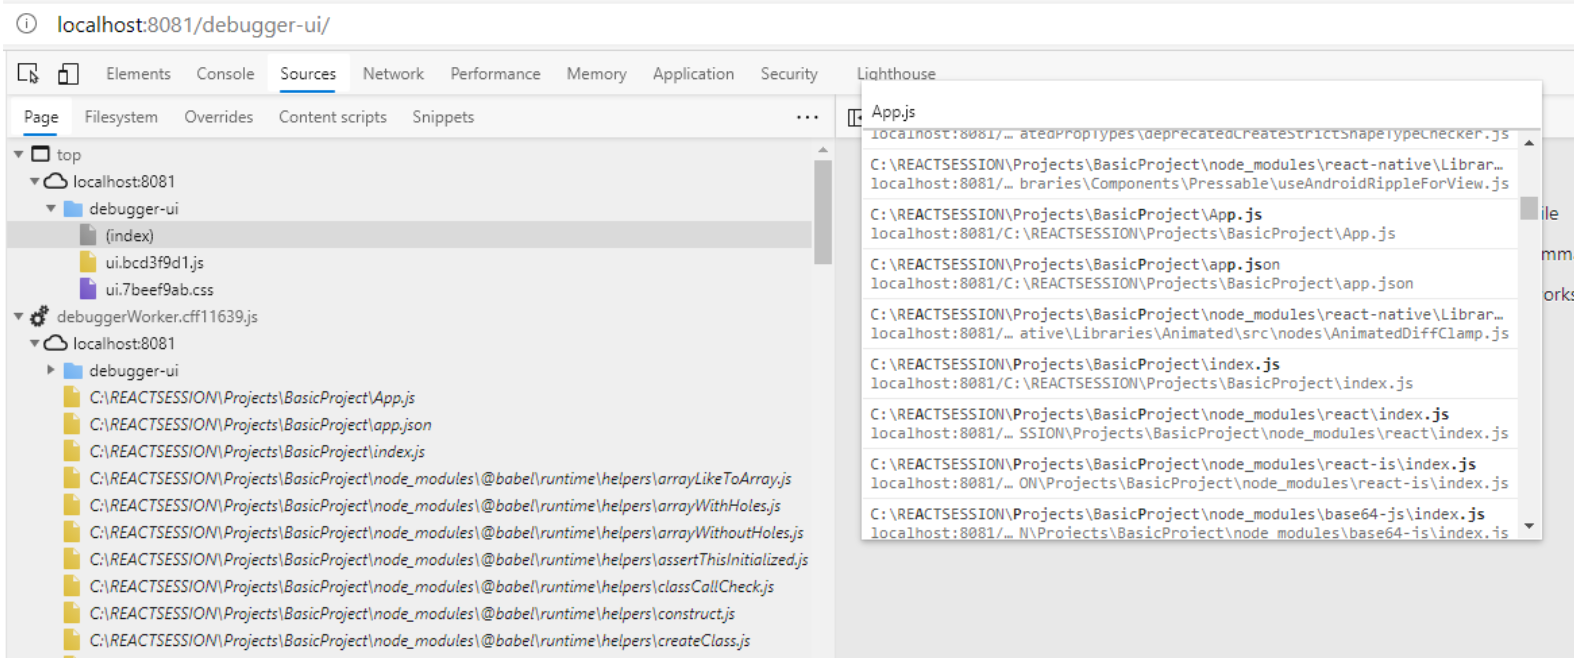
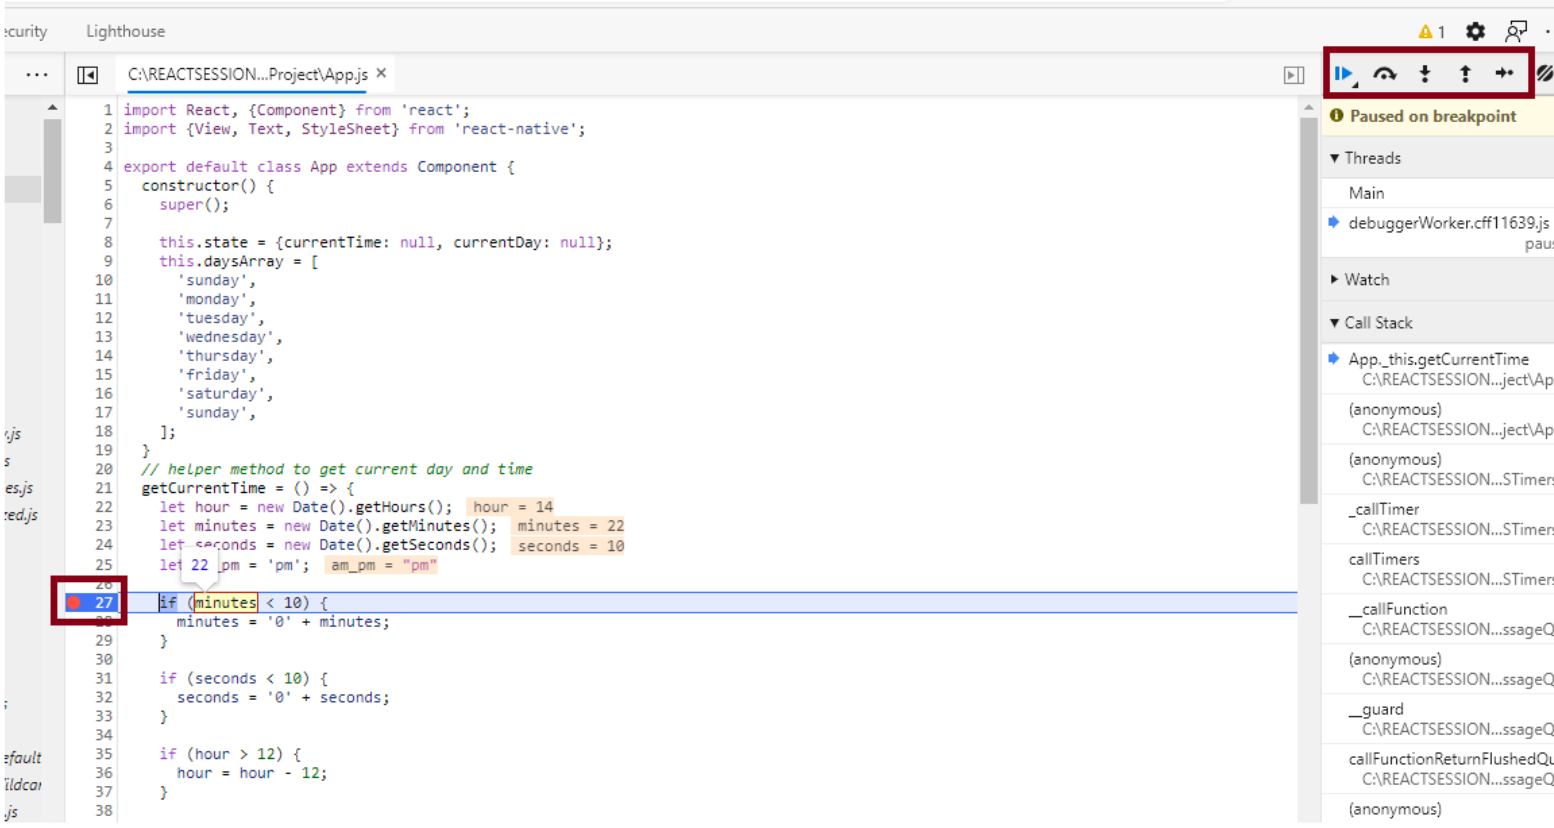
To debug our code we will access source tab Page,
here with Ctrl+P we can search for the source file where we want to place breakpoints
We can place breakpoints by clicking a line in the line number section.
then run the test,
flow sill stop in our breakpoints and then we can use F keys or commands from the bar to debug step by step or go inside of a function code
here we can see the values of objects and variables by selecting them.
It is possible as well to add objects or variables to the watch list to see their content, clicking right button in a variable and selecting the option add to watch list.


